What Do Statistics Tell Us about Artists with a Foreign Background in Finland? Diversity Report 2025 – Statistical Section
Summary
This publication examines the number of artists with a foreign background in Finland, as well as their background characteristics, education, working conditions, and income. The analysis is based on several statistical and research sources, including Statistics Finland’s Employment Statistics, grant statistics from the Arts Promotion Centre Finland, and the Vipunen education statistics service. The publication is part of Cupore’s diversity reporting, which aims to monitor the cultural and arts sector from the perspectives of equality, diversity, and inclusion.
Introduction
This publication compiles information from various sources on the number of artists with a foreign background in Finland, their demographic characteristics, distribution across art fields, working conditions, and income. Foreign background is examined through country of origin, citizenship, and mother tongue.
The sources used include grant statistics from the Arts Promotion Centre Finland, Statistics Finland’s Employment Statistics, and the Vipunen education statistics service. In addition, results from Cupore’s register-based study As an Artist in Finland have been organised into a thematic overview focusing on artists with a foreign background.
The publication is part of a broader body of work produced by Cupore examining the cultural and arts sector from the perspectives of equality, diversity, and inclusion. This builds on the report of the working group Cultural Policy, Immigrants and the Promotion of Cultural Diversity (2021) and the related action programme (2023), which propose that Cupore should regularly monitor and report on these themes (Ministry of Education and Culture, 2021, 2023).
In 2023, Cupore published the first diversity report, Artists with a Foreign Background in Finland, commissioned by the Ministry of Education and Culture. It examined the situation of artists with a foreign background in Finland using existing statistical and research sources. The main emphasis was on regularly produced sources, but it also included recent one-off studies.
In this publication, the tables and figures included in the 2023 Diversity Report are updated where applicable. The publication is part of the 2025 diversity reporting. A second part examines, through interviews, the career paths, working conditions, and position of artists with a foreign background. The interviews deepen the picture created in the 2023 report.
Metadata play an important role in this publication, as both the definition of “artist” and the identification of “foreign background” vary across statistical and data sources. Different sources provide differing perspectives and produce varying results regarding education, employment, and funding. The classification or definition used is specified in connection with each dataset.
Contents
Employed persons in arts, architecture and design occupation by origin
Share of foreign language speakers in grant statistics by the Arts Promotion Centre Finland
Vipunen education statistics: arts education and personnel by origin
As an Artist in Finland
Employed persons in arts, architecture and design occupation by origin
According to Statistics Finland’s Employment Statistics, there were approximately 24,100 employed persons in the arts, architecture, and design occupations examined in Table 1 in 2023. The number of employed persons in these occupations decreased by 6.2% between 2021 and 2023. The decrease concerned persons with a Finnish background (–7.0%), while the number of persons with a foreign background increased slightly (1.6%). In 2023, there were 1,977 persons with a foreign background in these occupations, corresponding to 8.2% of the total.
Statistics Finland’s classification by origin divides the population into persons with a Finnish background and those with a foreign background. Persons with a foreign background are defined as individuals whose both parents (or the only known parent) were born outside Finland.
There are considerable differences between occupations in terms of origin. In 2023, the lowest shares of persons with a foreign background were among actors (3.1%), landscape architects (3.7%), and writers (4.6%). Language plays a central role in literature and performing arts. The highest share of persons with a foreign background was found among dancers and choreographers (18.0%).
Data from the Employment Statistics disaggregated by background were separately commissioned for diversity reporting (personal communications, Meri Raijas, Statistics Finland, October 10, 2023; Elina Pelkonen, Statistics Finland, January 23, 2026).
Table 1. Employed persons in arts, architecture and design occupations by origin.
Source: Statistics Finland, Employment Statistics.
Share of foreign language speakers in grant statistics by the Arts Promotion Centre Finland
When the Arts Promotion Centre Finland was established in 2013, foreign language speakers accounted for 4% of grant applicants (Figure 1) (Arts Promotion Centre Finland, 2025). By 2024, the share had increased to 7%. Swedish-language applicants accounted for 5% in 2024. Among grant recipients, foreign language speakers accounted for just over 6%, and Swedish-language speakers for 4%. The most commonly reported foreign languages among applicants in 2024 were English, Spanish, and Russian, as in previous years (Arts Promotion Centre Finland, 2025).
Figure 1. Arts Promotion Centre Finland’s grants for individuals in 2013–2024: share of foreign language speakers among applicants and recipients*.
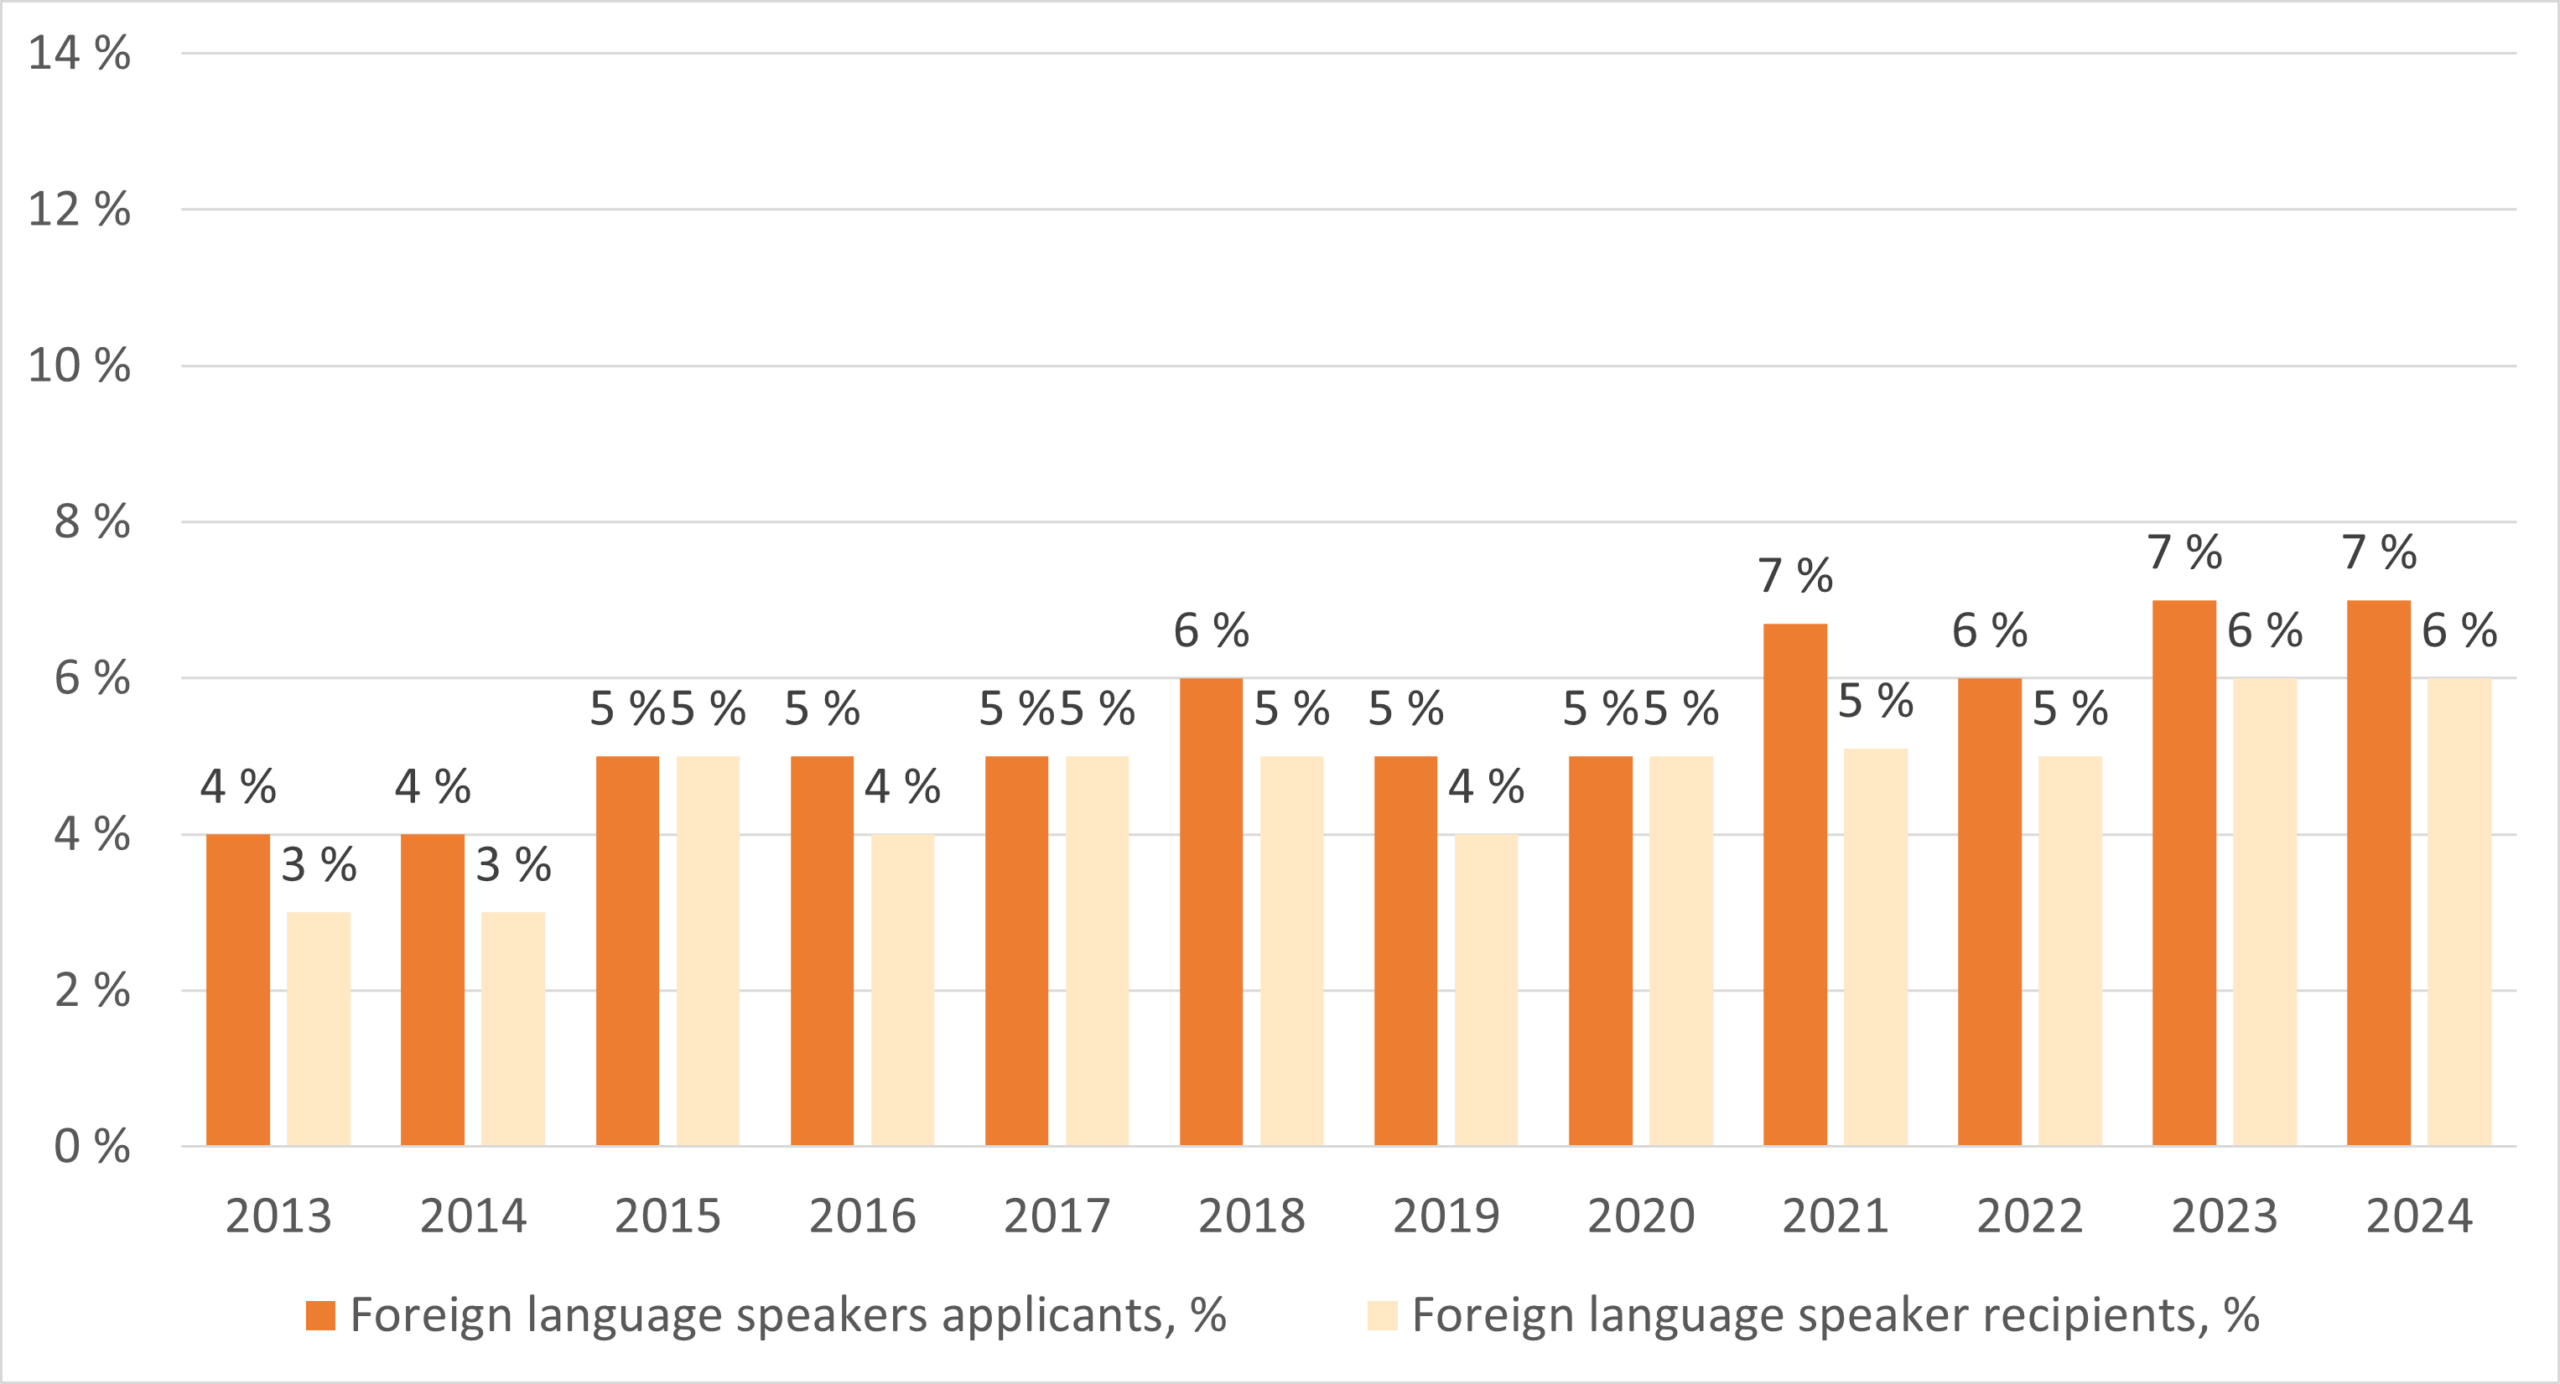
* Natural persons (individuals). For 2013–2016 also the applicants and recipients of community subsidies (contact persons) are included.
Source: Arts Promotion Centre Finland, 2014–2025.
In 2024, the shares of foreign language applicants were highest in multidisciplinary art (15%) and architecture (11%), while the shares of foreign language recipients were highest in multidisciplinary art (15%) and photography (12%) (Figure 2) (Arts Promotion Centre Finland, 2025). Multidisciplinary art was one of the options on the grant application form.
In absolute numbers, foreign language applicants were most numerous in visual arts (158), music (97), and multidisciplinary art (63). Foreign language grant recipients were most numerous in visual arts (29), music (11), and photography (8) (Arts Promotion Centre Finland, 2025).
Figure 2. Arts Promotion Centre Finland’s grants to individuals in 2024: share of foreign language speakers among applicants and recipients by artform (%)*.
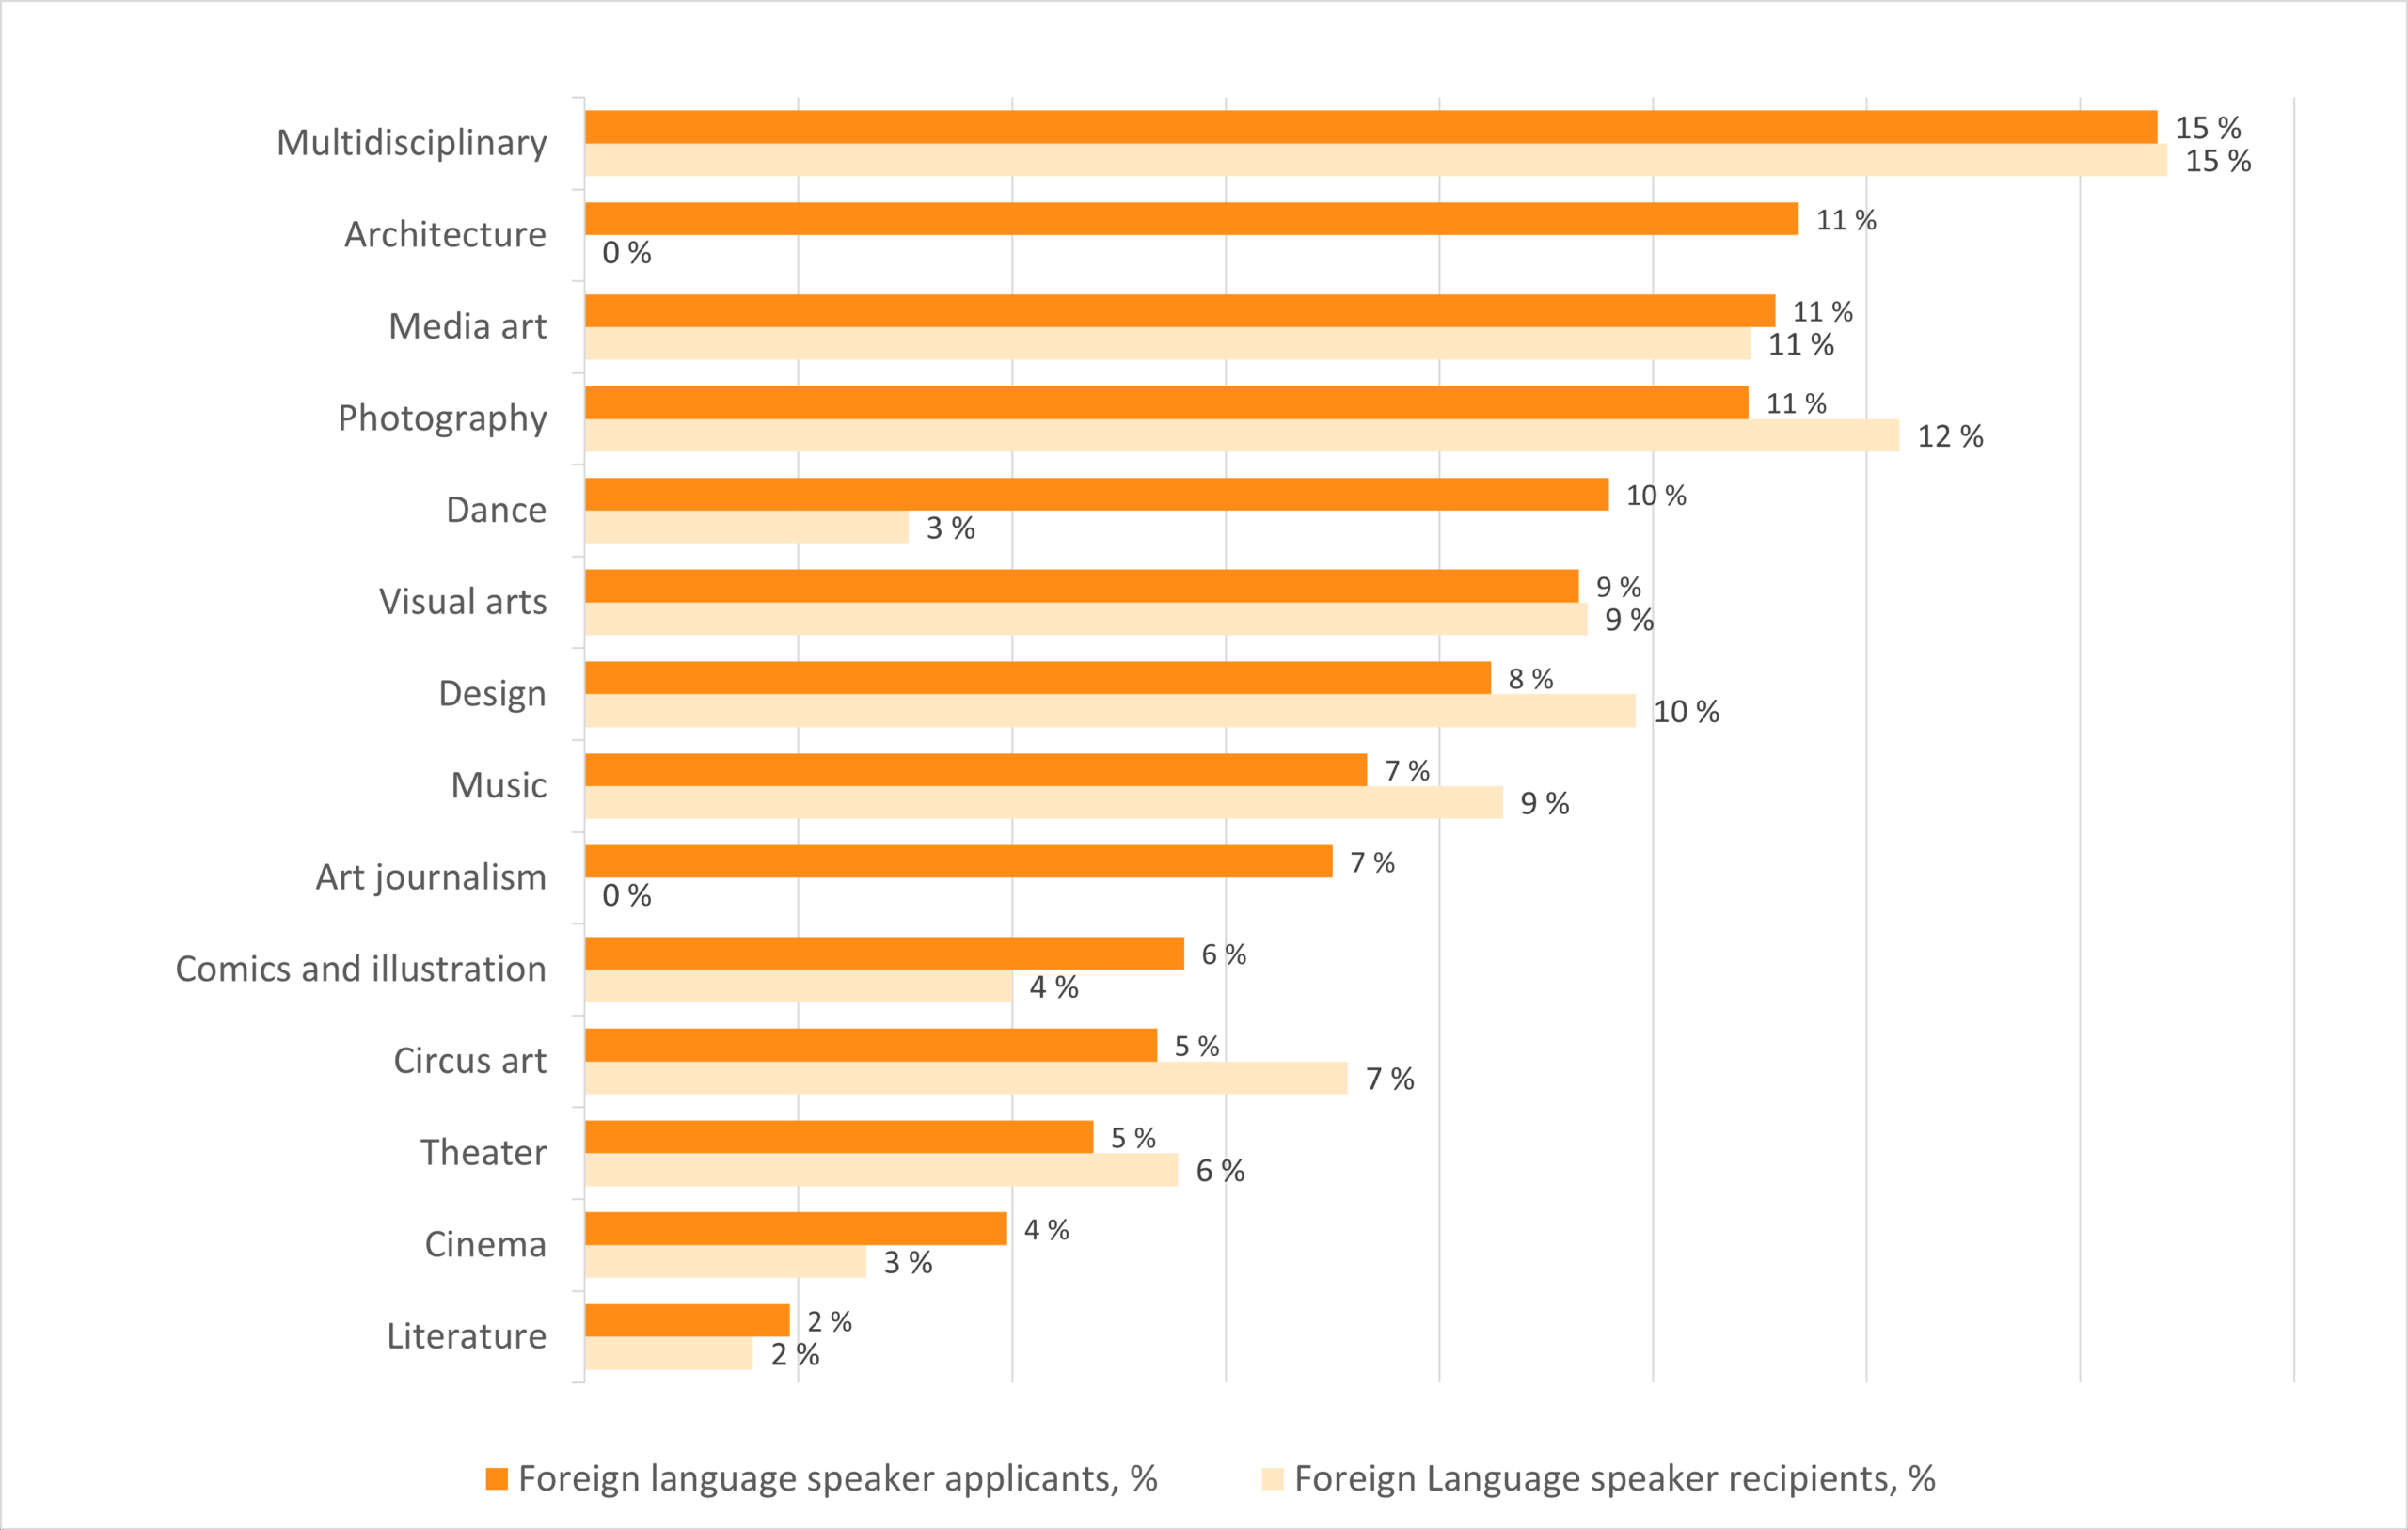
*Natural persons (individuals). Does not include working groups’ contact persons.
Source: Arts Promotion Centre Finland, 2025.
The Arts Promotion Centre Finland (2013–2025) published annual statistics on its support for promoting the arts and culture. The allocation and statistical reporting of grants continue under the Finnish Arts and Culture Agency, which began its operations in 2026.
In grant statistics, foreign background is examined for natural persons (individuals). The statistics are based on information provided in the application form. Applicants have not been asked about origin; instead, mother tongue has been used as a proxy.
The application form includes domestic languages (Finnish, Swedish, Sámi, and a national sign language) and “other” as response options. In recent years, applicants selecting “other” have been presented with an optional open-ended follow-up question. A person reporting more than one language is classified as a foreign language speaker if none of the reported languages is a domestic language (Arts Promotion Centre Finland, 2025).
However, some applicants do not respond to the question on mother tongue, and some report Finnish even if it is not their actual first language (Pilvikki Heinonen, Arts Promotion Centre Finland, personal communication, November 28, 2023). In the future, the new government grant system will enable language data to be obtained directly from the Digital and Population Data Services Agency.
Vipunen education statistics: arts education and personnel by background
Persons with an arts degree in the population by origin
In 2023, Finland’s population aged 15 and over included approximately 113,500 persons whose highest completed degree was in the arts (Table 2). The share of persons with an arts degree was 2.4% of the population. Among persons with a foreign background, the share was just over one percentage point lower (Vipunen – Education Statistics Finland, n.d.-a).
According to Vipunen, there were 6,150 persons with a foreign background with an arts degree in Finland, the majority of whom were born abroad. Most commonly, the degree had been completed at the level of vocational education or a master’s degree. Among those holding a doctoral degree in the arts, approximately 12% had a foreign background (Vipunen – Education Statistics Finland, n.d.-a).
Table 2. Persons aged 15 and over with an arts degree by origin and level of education in 2023, and share of the population group in 2021 and 2022.
| Level of education in arts* | Finnish background, born in Finland | Finnish background, born abroad | Foreign background, born in Finland | Foreign background, born abroad | Population aged 15 and over with an arts degree |
| Vocational education | 49 347 | 687 | 162 | 1 935 | 52 131 |
| Further vocational qualification | 4 851 | 105 | 1–4 | 228 | 5 187 |
| Specialist vocational qualification | 768 | 18 | 42 | 828 | |
| Post-secondary non-tertiary education | 4 950 | 75 | 9 | 327 | 5 361 |
| UAS Bachelor’s degree** | 22 464 | 363 | 36 | 588 | 23 454 |
| Lower university degree | 3 681 | 66 | 21 | 504 | 4 272 |
| UAS Master’s degree** | 1 812 | 27 | 1–4 | 123 | 1 962 |
| Master’s degree | 16 896 | 273 | 21 | 2 004 | 19 194 |
| Licentiate degree | 150 | 1–4 | 24 | 177 | |
| Doctoral degree | 852 | 12 | 1–4 | 120 | 987 |
| Total | 105 774 | 1 626 | 258 | 5 892 | 113 550 |
| Share of population group 2023 | 2,5 | 3,4 | 1,0 | 1,3 | 2,4 |
| Share of population group 2022 | 2,5 | 3,4 | 1,0 | 1,4 | 2,4 |
| Share of population group 2021 | 2,4 | 3,4 | 1,0 | 1,5 | 2,4 |
*Refers to the highest completed degree. Field of education classification, level 2: Arts.
Note: The data have been subject to statistical disclosure control in Vipunen. Values between 1–4 are reported as “1–4”, and values above four are rounded to the nearest number divisible by three. Percentages are calculated based on protected values. The resulting deviations are marginal for larger values. For example, for 100 cases the error is at most 1%, and for 1,000 cases at most 0.1%.
** UAS = University of Applied Sciences
Source: Vipunen – Education Statistics Finland (n.d.-a).
The data on the educational attainment of the population are derived from Statistics Finland’s Register of Completed Education and Degrees, which contains gaps with regard to degrees completed abroad. The register does not provide a reliable picture of the educational structure of the population with a foreign background (Mika Witting, Statistics Finland, personal communication, November 22, 2023).
Share of persons of immigrant background among arts students and graduates
According to Vipunen, nearly 9% of arts students and just over 9% of graduates were of immigrant background in 2023 (Table 3). In vocational and polytechnic education, the shares were lower, while in university education they were higher (Vipunen – Education Statistics Finland, n.d.-c). In 2023, the share of graduates with an immigrant background in the university sector was just over 19%.
The data in Table 3 have been drawn from the internationalisation reports in the “Education – general” section of Vipunen. Immigrant background is otherwise defined in the same way as foreign background in Statistics Finland (both parents born outside Finland), but among higher education students, those whose year of migration to Finland coincides with their first year of enrolment in degree studies are not classified as immigrants. They are interpreted as having moved to Finland for the purpose of studying.
Different education classifications and their interrelationships can be examined at: https://koulutusluokitus.fi/ (in Finnish)
Table 3. Students and graduates with an immigrant background in arts education by education sector in 2022 and 2023*.
| Year/Education sector | Students | Share of students, % | Graduates | Share of graduates, % |
| 2022 | 2 583 | 8,2 | 414 | 7,5 |
| Vocational education | 963 | 5,6 | 150 | 5,2 |
| UAS education | 603 | 7,4 | 87 | 6,3 |
| University education | 1 017 | 15,9 | 177 | 14,8 |
| 2023 | 2 811 | 8,8 | 546 | 9,3 |
| Vocational education | 1 056 | 6,1 | 189 | 6,2 |
| UAS education | 681 | 8,1 | 87 | 6,0 |
| University education | 1 071 | 17,1 | 270 | 19,4 |
| Total (years 2022 and 2023) | 5 394 | 8,5 | 960 | 8,5 |
* Field of education classification, level 2: Arts.
Source: Vipunen – Education Statistics Finland (n.d.-c).
Share of foreign nationals among teaching and research staff in higher arts education
According to Vipunen, in 2024 foreign nationals accounted for 13.0% of person-years of teaching and research personnel in the fields of arts and culture at the University of the Arts Helsinki (58 person-years) and 27.4% at Aalto University (67 person-years) (Table 4). The largest share of international teaching and research personnel consisted of citizens of European countries. At Aalto University, the share of Europeans was 15%, while the shares of citizens from other continents ranged between 0.5% and 4.8%. At the University of the Arts Helsinki, the share of citizens of European countries was 7.4%, and the shares of citizens from other continents ranged between 0.2% and 2.8%.
Table 4. Teaching and research personnel in the fields of arts and culture by nationality at the University of the Arts Helsinki and Aalto University in 2024.
| University of the Arts Helsinki | Aalto University | |||
| Person-years | % | Person-years | % | |
| Finland | 388 | 87,0 % | 176 | 72,6 % |
| Europe | 33 | 7,4 % | 36 | 15,0 % |
| Latin America and the Caribbean | 3 | 0,7 % | 12 | 4,8 % |
| North America | 6 | 1,3 % | 5 | 2,1 % |
| Africa | 2 | 0,5 % | 1 | 0,5 % |
| Asia | 13 | 2,8 % | 10 | 4,3 % |
| Oceania | 1 | 0,2 % | 2 | 0,9 % |
| Total | 446 | 100,0 % | 243 | 100,0 % |
Source: Vipunen – Education Statistics Finland (n.d.-b).
Table 4 is based on Vipunen’s personnel reports, which can be used to examine the distribution of teaching and research personnel in higher education institutions by nationality. The unit used in the reports is the person-year (full-time equivalent), and information on nationality is provided at the level of continent. The data are based on the Ministry of Education and Culture’s annual data collection and are classified according to the ministry’s field-of-education classification. The category “Arts and culture” includes, in addition to the arts disciplines, education related to arts research and arts education (such as art history, theatre studies, or music education).
As an Artist in Finland
Data from the As an Artist in Finland research will be published in 2026 once data collection has been completed.
References
Arts Promotion Centre Finland. (2014–2024). Grant statistics: Support for the promotion of arts and culture 2013–2023. https://www.taike.fi/fi/tilastot-ja-julkaisut/apurahatilastot
Arts Promotion Centre Finland. (2025). Support for the promotion of arts and culture 2024 (with data appendices). https://www.taike.fi/fi/julkaisut/taiken-tuki-taiteen-ja-kulttuurin-edistamiseen-2024
Karttunen, S., Lahtinen, E., Valkama, H. & Leppänen, A. (2023). Artists with Foreign Background in Finland. Diversity Report 2023. Center for Cultural Policy Research Cupore. https://www.cupore.fi/en/publications/artists-with-foreign-background-in-finland/
Ministry of Education and Culture. (2021). Art, Culture and Diverse Finland: Final Report of the Working Group for Cultural Policy, Immigrants and Promotion of Cultural Diversity. Publications of the Ministry of Education and Culture, Finland 2021:5. http://urn.fi/ URN:ISBN:978-952-263-884-7
Ministry of Education and Culture. (2023). Art, Culture and Diverse Finland: The Ministry of Education and Culture’s action plan to promote diversity in the field of arts and culture. Publications of the Ministry of Education and Culture, Finland 2023:29. http://urn.fi/URN:ISBN:978-952-263-932-5
Vipunen – Education Statistics Finland. (n.d.-a). Educational structure of the population aged 15 and over by origin/background (Dataset 4.sd). Finnish National Agency for Education. Retrieved April 8, 2026, from https://vipunen.fi/fi-fi/_layouts/15/WopiFrame.aspx?sourcedoc=%7bd89ebe03-fa47-4c09-8e50-26e0f9a6d901%7d&action=view
Vipunen – Education Statistics Finland. (n.d.-b). Higher education personnel (Dataset). Finnish National Agency for Education. Retrieved April 8, 2026, from https://vipunen.fi/fi-fi/_layouts/15/WopiFrame.aspx?sourcedoc=%7b955258cb-47e0-4ceb-bcaf-a2284f747fd3%7d&action=view
Vipunen – Education Statistics Finland. (n.d.-c). Students, new students and graduates of immigrant background (Datasets K2.17, 2.4h). Finnish National Agency for Education. Retrieved April 8, 2026, from https://vipunen.fi/fi-fi/_layouts/15/WopiFrame.aspx?sourcedoc=%7b483d6429-ce4c-4306-af16-f7f018ba09e7%7d&action=view
Authors
-

-
 Minna Ruusuvirta Senior Researcher, D.Soc.Sc., MEcon. +358 50 326 8014 minna.ruusuvirta@cupore.fi Profile
 -

-
